At Photoroom, we run AI inference at scale. Every time a user removes a background, upscales an image, or generates a creative variation, a request lands on one of our GPU pods. These pods are expensive, and getting the most out of every single GPU matters, both for cost and for user experience.
Our inference runs on Kubernetes, with a fleet of Envoy proxies routing traffic to GPU pods. We knew load balancing wasn’t perfect. We could see uneven distribution and the occasional latency spike. But with most models running under 300ms, response times were still quite good.
Then we shipped a new model for our AI Background feature. A significant quality upgrade, but inference time jumped to around one second per request. Our p90 shot up to 7 seconds, p99 above 20, yet GPU utilization showed we had capacity to spare. The worst of both worlds: users waiting in queues while GPUs sat idle.
We needed a load balancer where every Envoy node could see the true, global state of in-flight requests across the entire cluster. So we built one.
Why Standard Algorithms Don’t Work Here
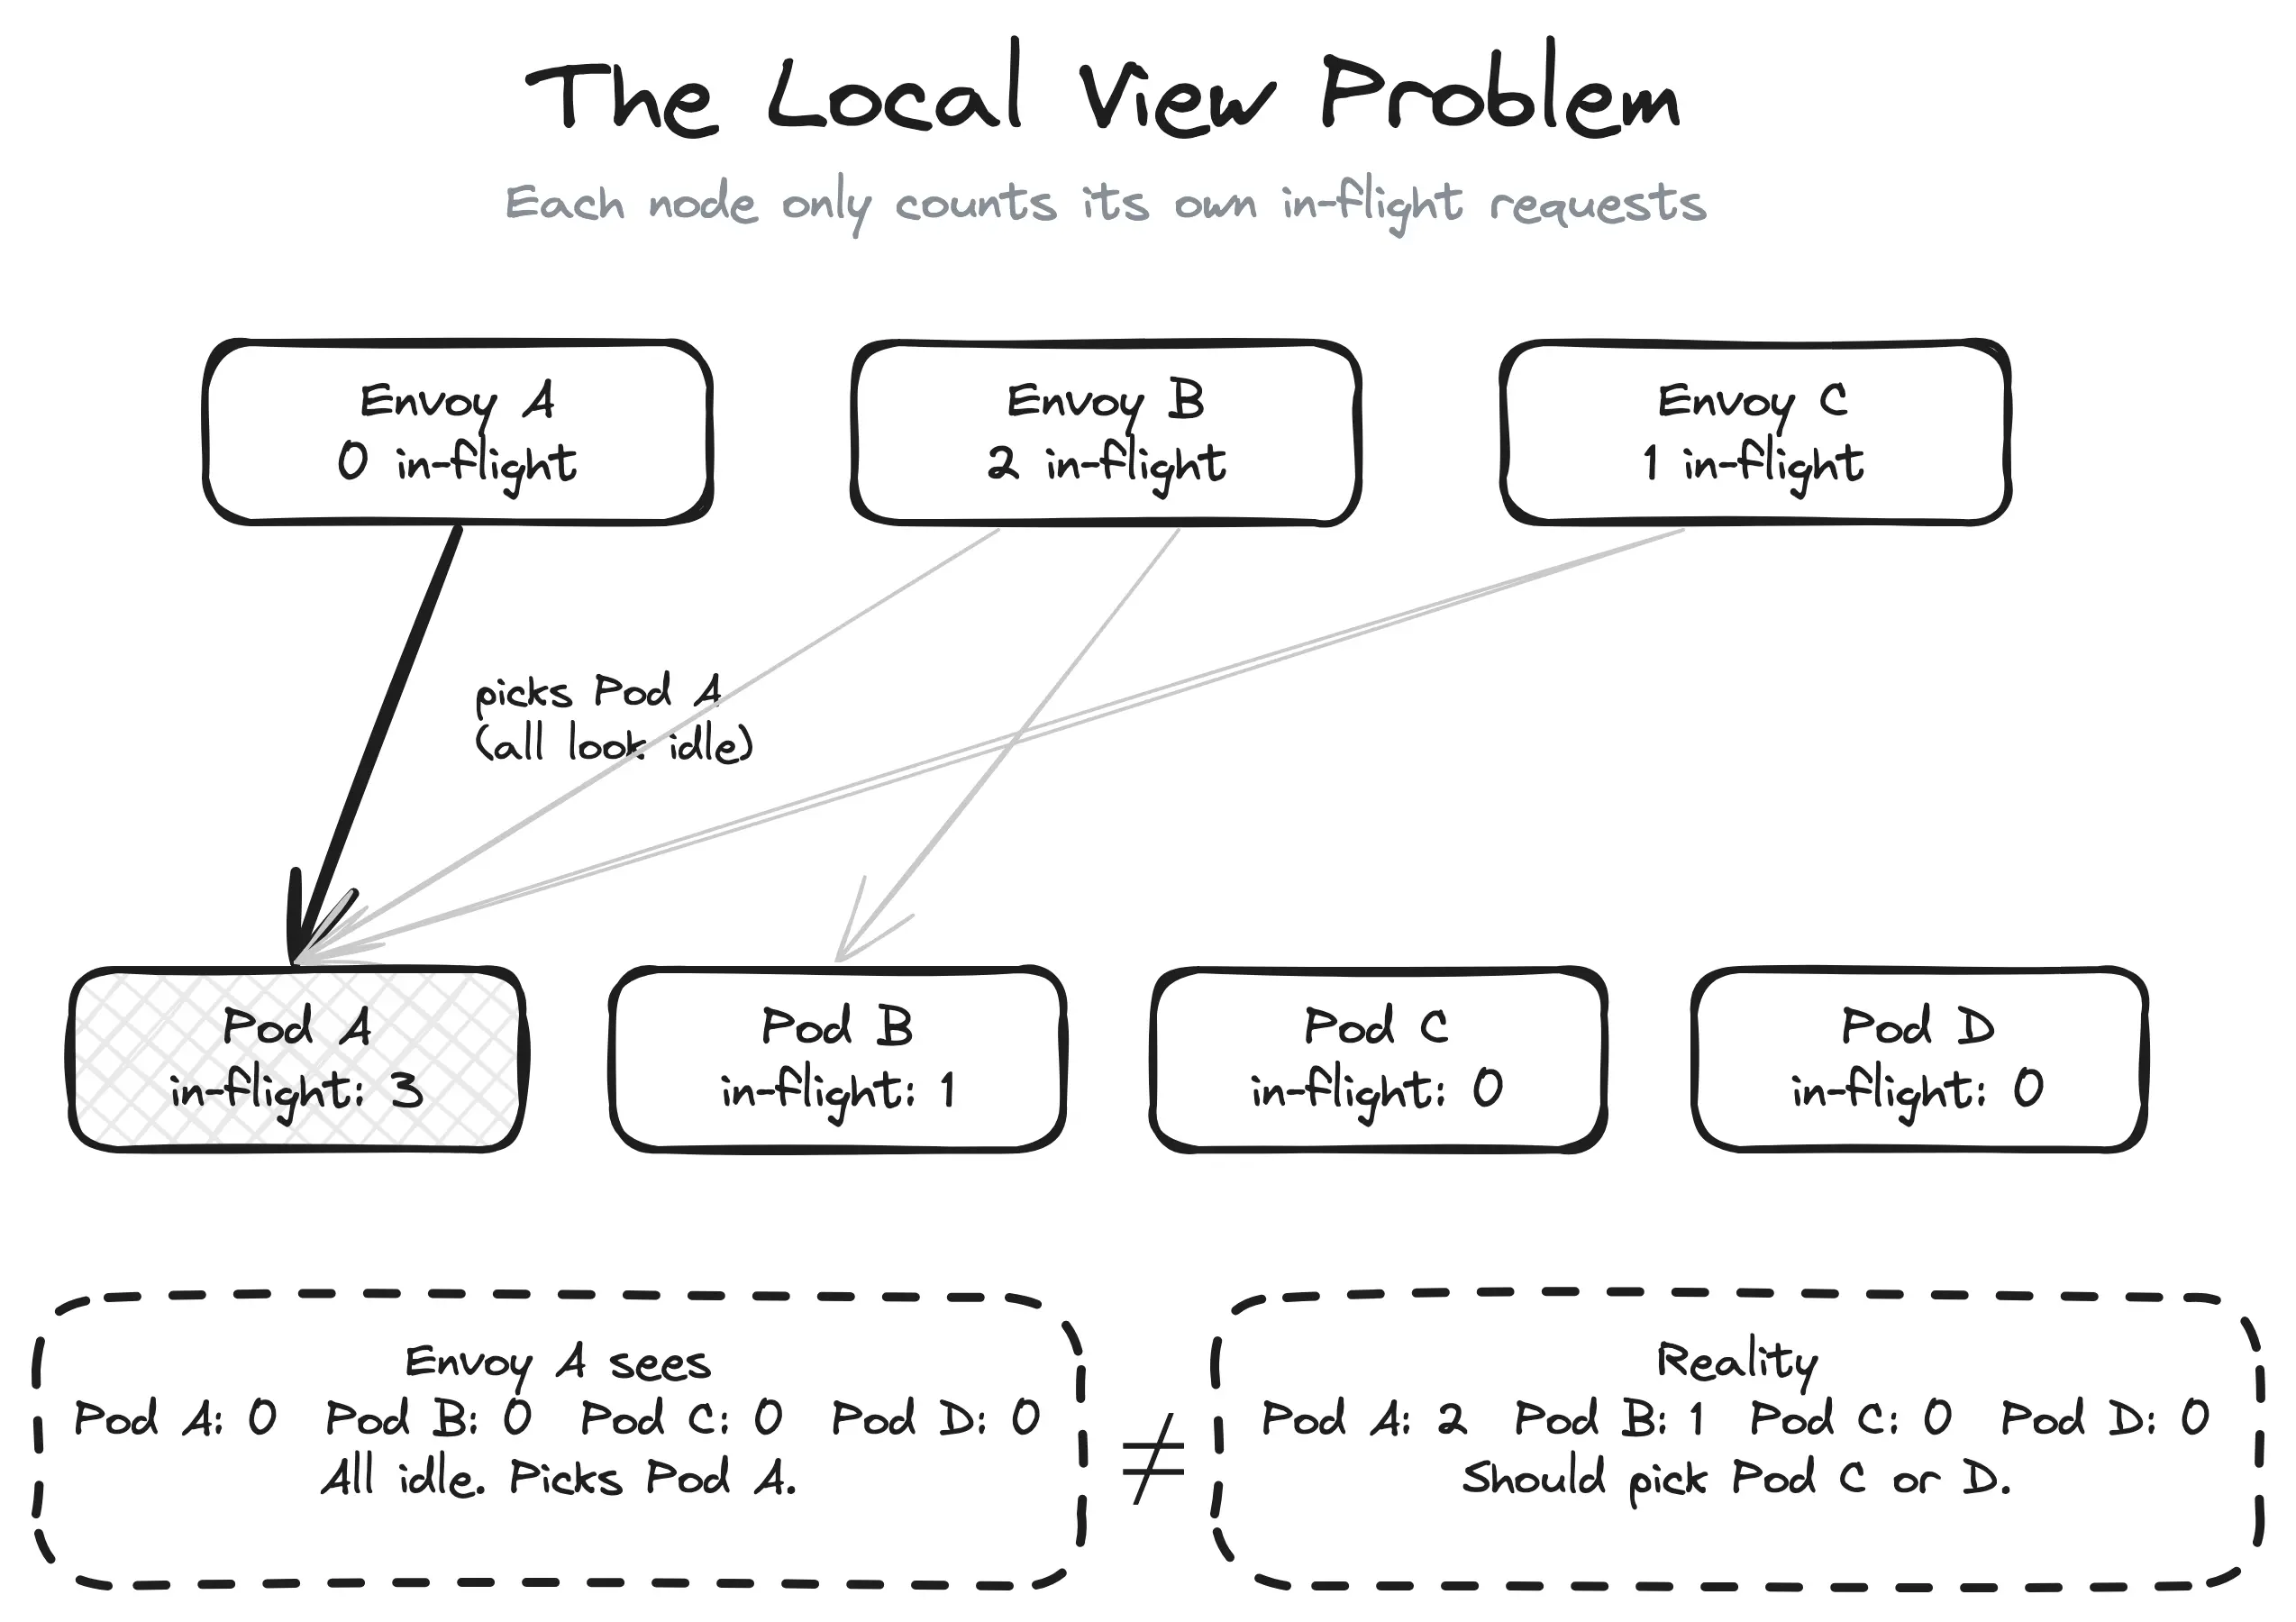
Envoy ships with solid load balancing algorithms: Round Robin, Least Request, Power of Two Choices (P2C). They range from simple to quite sophisticated, but they all share the same fundamental limitation: each Envoy node only sees the requests it sent itself.
This is the local view problem. With 10 Envoy nodes routing to 20 GPU pods, each node sees roughly one-tenth of the total traffic. A pod could have 9 in-flight requests from other nodes but appear completely idle to yours. Every node makes locally rational decisions that are globally suboptimal.
To make this concrete: imagine Pod A has received 1 request from your Envoy node but 9 from the other nine nodes, so 10 in-flight total. Pod B has received 0 requests from your node but only 1 from others, so 1 in-flight total. Your Envoy node sees Pod A at 1 and Pod B at 0. It picks Pod B, that’s fine. But flip the scenario slightly and your node sends its next request to the already-overloaded Pod A, because it looks idle from where you’re standing.
It doesn’t matter how smart the algorithm is. Least Request picks the pod with the fewest in-flight requests, but if it only counts its own, the answer is wrong. P2C picks the better of two random choices, but “better” based on a partial view is still a guess. The algorithm isn’t the problem. The input is.
To be fair, these algorithms work perfectly well in more common scenarios, like a high volume of fast requests against a handful of backends. The local view is inaccurate, but requests come and go so quickly that it doesn’t matter much. Our inference context is different: a relatively low volume of slow requests (~1s each) spread across a large pool of GPU pods. Each request occupies a pod for long enough that routing mistakes compound, and with many pods the fraction of traffic each Envoy node sees gets smaller. That’s when the local view stops being “close enough” and queueing becomes very visible.
With N proxy nodes, each one sees 1/N of the picture. The more nodes you have, the worse it gets.
 Local view problem
The Solution: A Shared View via Redis
The fix is conceptually simple: instead of each Envoy node tracking its own request counts, put the counters in a shared store that every node reads from and writes to. We chose Redis.
The architecture looks like this:
A request arrives at an Envoy node
Envoy calls our ext_proc (External Processing) service over gRPC
ext_proc queries a Redis sorted set to find the least-loaded pod
ext_proc returns the selected pod’s IP to Envoy via a response header
Envoy routes the request to that pod
When the response comes back, Envoy calls ext_proc again, and we decrement the counter
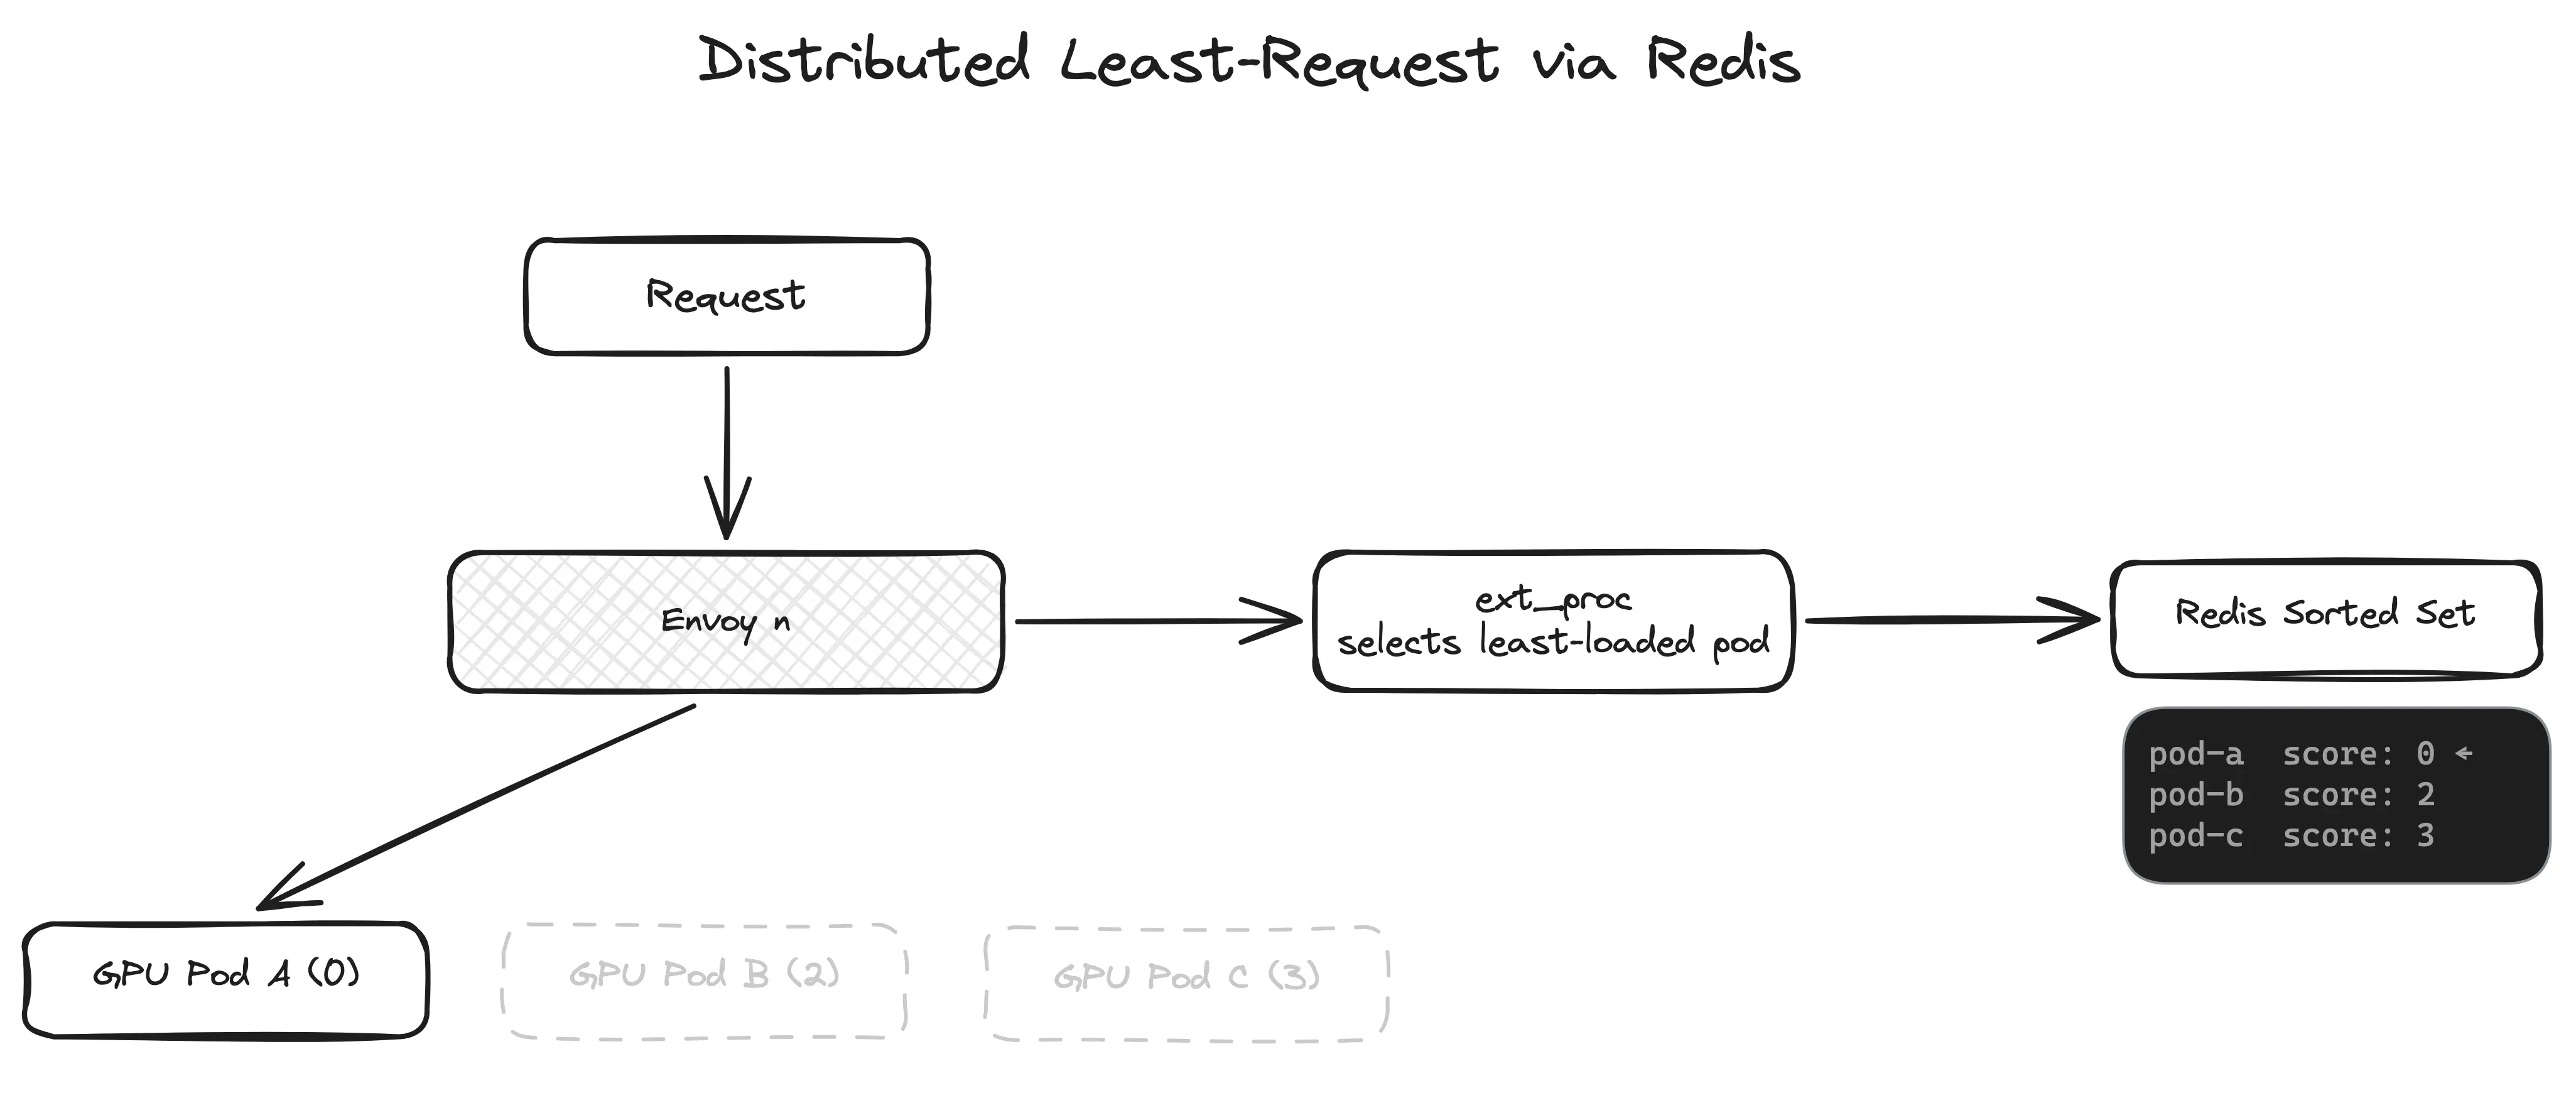 Distributed least-request via RedisWhy ext_proc? Envoy’s External Processing filter lets us hook into the request lifecycle at the header phase. We intercept the request before it’s routed, make our selection, and inject the target endpoint as a header. Envoy then routes accordingly. It’s a clean extension point: we don’t fork Envoy or write a custom filter in C++.
Why Redis sorted sets? A sorted set is exactly the data structure we need. Members are pod IPs, scores are in-flight request counts. ZRANGE key 0 0 gives us the member with the lowest score the least-loaded pod, in O(log N). Every Envoy node in the cluster reads from and writes to the same sorted set, so every node has a global view of load at all times.
No gossip protocol, no consensus algorithm, no custom distributed state machine. Just a sorted set in Redis.
The Core Algorithm: Two Lua Scripts
The heart of the system is a Lua script that runs atomically inside Redis. When a request arrives, we need to:
Find the pod with the fewest in-flight requests
Increment its counter
Return its IP
These three steps must be atomic. If two Envoy nodes query at the same time and both see Pod A at score 0, they’d both pick Pod A, defeating the purpose. Redis Lua scripts run single-threaded, so atomicity is guaranteed.
Here’s the selection script:
local key = KEYS[1]
local member = redis.call('ZRANGE', key, 0, 0)[1]
if member then
    redis.call('ZINCRBY', key, 1, member)
    return member
else
    return nil
end
Three lines of actual logic. ZRANGE key 0 0 gets the member with the lowest score. ZINCRBY key 1 member atomically increments it. The next caller will see the updated score.
When the response comes back through ext_proc, we run the decrement script:
local key = KEYS[1]
local member = ARGV[1]
local score = redis.call('ZSCORE', key, member)
if score and tonumber(score) > 0 then
    redis.call('ZINCRBY', key, -1, member)
end
return score
That’s the full request lifecycle: increment on request, decrement on response. The sorted set always reflects the true global state.
We use EVALSHA to call pre-loaded script hashes rather than sending the full script on every request. If Redis restarts and loses the script cache, we detect the NOSCRIPT error and automatically reload.
Keeping Redis in Sync with Kubernetes
The sorted set needs to reflect the actual set of running pods. GPU pools auto-scale, and pods come and go. If a pod gets terminated but its entry lingers in Redis, we’d route requests to a dead endpoint.
We run an endpoint watcher that watches Kubernetes EndpointSlices for each service. When pods scale up or down, the watcher updates the Redis sorted set: new pods are added with a score of 0, removed pods are deleted. Existing pods keep their current scores. We don’t reset counters on every sync.
This runs as a background reconciliation loop. The watcher queries for endpoints with the kubernetes.io/service-name label, formats them as IP:PORT pairs, and calls UpdateEndpoints() to atomically sync the sorted set.
It’s a simple pattern, but it’s critical. Without it, the system drifts: stale entries cause routing errors, missing entries cause uneven load.
Results
Here’s what happened when we deployed the distributed least-request balancer on one of our services:
![]() The deployment happened around 16:55. Two things are immediately visible:
The deployment happened around 16:55. Two things are immediately visible:
Latency collapsed. The top panel shows Envoy gateway latency percentiles. Before deployment, p99 was spiking to 20-25 seconds, with p95 around 10 seconds. After deployment, all percentiles collapsed into a tight band around 1-2 seconds. The spread between p50 and p99 essentially disappeared.
Queueing vanished. The bottom panel shows pending requests per Triton pod. Before deployment, multiple pods had persistent queues of 1-3 requests, some pods were constantly backed up while others sat idle. After deployment, queueing became rare: only occasional spikes of a single request, quickly resolved.
The key insight: the inference time didn’t change. Pods still process requests in about one second. What changed is that requests are now distributed evenly, so no pod accumulates a queue while its neighbors sit idle.
The Trade-offs
Redis is now in the critical path. Every request makes a round-trip on the header phase, before the payload is even sent to the upstream. In practice, the Lua eval is sub-millisecond, so it doesn’t add meaningful latency.
Redis is a single point of failure. We run a managed high-availability Redis, and if it does go down, the sorted set keys can be reconstructed quickly from the Kubernetes endpoint watcher. In the meantime, Envoy falls back to its default local load balancing.
An Unexpected Opportunity: Load Shedding
Once we had a global view of in-flight requests per pod, we realized we were sitting on something more powerful than just a load balancer. The same sorted set that tells us “which pod is least loaded” also tells us “is the entire pool overloaded.” That’s a different question and answering it opens the door to load shedding.
The extension is a few lines in the Lua script:
local key = KEYS[1]
local maxInflightRequests = tonumber(ARGV[1])
local member = redis.call('ZRANGE', key, 0, 0)[1]
if member then
    local score = redis.call('ZSCORE', key, member)
    if tonumber(score) >= maxInflightRequests then
        return redis.error_reply("MAX_QUEUE_SIZE_EXCEEDED")
    end
    redis.call('ZINCRBY', key, 1, member)
    return member
end
If even the least-loaded pod has hit the max in-flight threshold, we know the entire pool is saturated. At that point, a fast 503 is better than a 30-second timeout.
From there, we built more sophisticated strategies on the same foundation: a queueing mode that holds requests in a Redis FIFO queue and retries when capacity frees up, allowing for controlled backpressure instead of blind overload. We also added priority-based scheduling with weighted queues, so critical requests can jump ahead while lower-priority traffic still gets a fair share.
None of this was the original goal. We built the sorted set to solve load balancing. But having a global, real-time view of cluster load turned out to be a platform, not just a feature.
Wrapping Up
For GPU inference workloads, standard load balancing algorithms are fundamentally broken. Round robin, least-request, P2C all make decisions based on a local view that diverges from reality as soon as you have more than one proxy node.
The fix turned out to be surprisingly simple: a Redis sorted set, two Lua scripts, and Envoy’s ext_proc filter. Every proxy node reads from and writes to the same shared state, so every node makes decisions based on the true global picture.
The results speak for themselves: p99 latency dropped from 25 seconds to 2 seconds, not because we made inference faster, but because we stopped queueing requests on pods that were already busy.
In the next article, we look at our global load balancer and how we extended this approach to route across multiple clusters and GPU providers.